Getting Started
Initialize
from optical import Annotation

root_dir = "/path/to/dataset"
data_format = "coco"
annotation = Annotation(root=root_dir, foramt=data_format)
optical expects the data to be organized in either of the following layouts:
root
├── images
│ ├── train
│ ├── val
│ └── test
└── annotations
  ├── train.json
  ├── val.json
  └── test.json
Note that for annotation formats which require individual annotations for each image (e.g., PASCAL VOC or Yolo), the annotations directory should also contain the same sub-directories as in images. The splits that do not have an annotation will be ignored.
If your data does not have a split to begin with, that’s fine. In that case the directory layout should be like below:
root
├── images
│ ├── 1.jpg
│ ├── 2.jpg
│ ├── ...
│ │
│ └── 100.jpg
│
└── annotations
  └── label.json
Tha name of the annotation file is not important in this case. But, if your format requires individual annotation files, the annotation files must have the identical name with that of the image.
EDA
Check data distribution:
annotation.describe()

| split | images | annotations | categories |
| ----- | ------ | ----------- | ---------- |
| train | 729    | 1121        | 3          |
| valid | 250    | 322         | 3          |
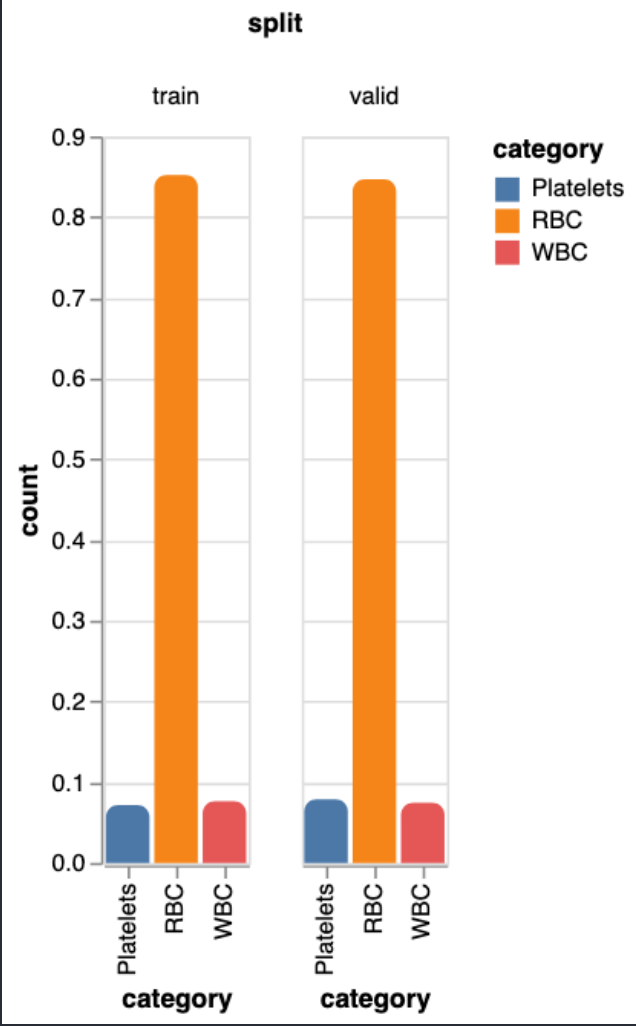
Plot label distribution:
annotation.show_distribution()
Scatter Plot of bounding box width and height:
annotation.bbox_scatter()

Visualization
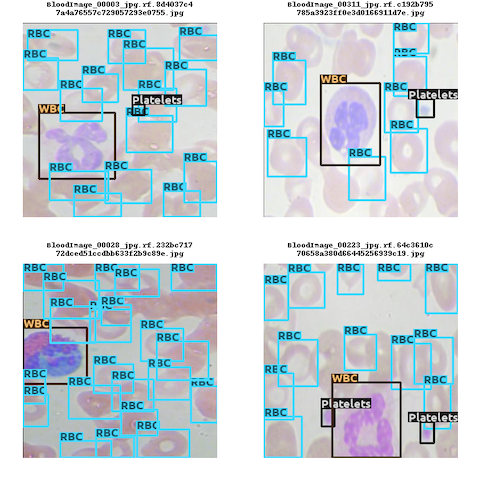
Batch Visualization:
vis = annotation.visualizer(img_size=256)
vis.show_batch()
Filters:
We can apply below filters before visualizing the annotations.
vis.show_batch(num_imgs=9,only_without_labels=True) # To only display images without annotations
vis.show_batch(num_imgs=9,only_with_labels=True) # To only display images with annotations
vis.show_batch(num_imgs=9,filter_categories=["WBC","RBC"]) # To only display images with given category annotations.
Video Visualization:
We can visualize whole dataset as a video which can be played in the jupyter notebook itself. This is intended for smaller datasets.
image_time = 1 #Meaning each image will be displayed for a second.
vis.show_video(image_time = image_time)
Splitting Dataset
splits = annotation.train_test_split(test_size=0.2, stratified=True)
splits.save("/path/to/output/dir")
Export to other formats
annotation.export(to = "yolo")